


Activity 3
Essential Question
- How does climate influence the activities of people?
Background
Most of the earth’s climate regions have an east-west orientation. However, mountains, warm water currents such as the Gulf Stream, and prevailing winds have influences that are sometimes greater than the effect of latitude. For example, a range of mountains with elevations of 14,000 feet, such as the Rocky Mountains, has a climate in the upper elevations that is similar in climate to locations at 65° north latitude throughout the year. Precipitation is just as important an indicator of climate as is temperature. Precipitation is necessary to support the natural vegetation, animals, and people living in a place. Many climate regions shown on maps have names that reflect the natural vegetation. For example, grasslands make up one of the world’s large climate regions.
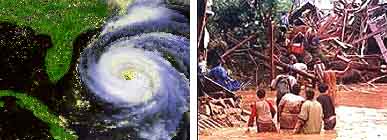
Hurricanes affect people’s lives
Instructional Strategies
Strategy 1 |
Interpreting Climate Maps
With the Climate Regions Summary Table and the Climate Map below, use the following questions to introduce the various climate regions of the world:
- How many climate regions does the map show?
- Why does it take so many classifications to show the earth’s climates?
Climate Regions Summary Table: Observations from the Climate Map
|
Color
|
Climate Region from Key
|
Orientation
|
| Tundra | East West(E/W), far North |
|
| Light Green | ||
| Bright Green | Broadleaf Forest | |
| Light Brown | Grassland (Steppe) | E/W |
| Brown | ||
| Desert | ||
| Yellow | E/W Africa to South America |
|
| Tropical Rain Forest |
Use the following questions to focus discussion about the table and map:
- Where do the patterns for climate regions closely follow latitude?
The earth rotates on its axis so that similar latitudes receive about the same amounts of direct sunlight during the year. This results in similar climatic conditions unless interrupted by mountains or large water bodies. - Where is the east west pattern of climate regions interrupted?
The interruption is greatest in the mountainous regions and along the west coasts of continents. - In general, if you were to leave the equator and travel to either the north or south poles, what changes would you observe in temperature?
The temperatures would get colder the further north or south one traveled; in summer the region from 35 to 45 degrees north and south is often as warm or hot as it is on the equator, but for a shorter time. - What prediction would you make about the amount of precipitation a climate region receives based on its name?
While the amount of precipitation in inches may vary, when a climate region is classified as tropical rainforest, the emphasis in on the rain. It is wet. When a region is classified as desert, it is dry. Tundra is a cold desert. Other climate regions are between huge amounts of rain and desert, and usually in this order: tropical rainforest – most precipitation; monsoon –next in amount of precipitation; deciduous forest – next in descending amount of precipitation; coniferous forest – next; savannah – next; steppe – next in descending order; tundra – next; and desert – least amount of precipitation. - Why aren’t climate regions nice and neat and exact?
Mountains, large bodies of water, and continents of different sizes interrupt them. The effects of a major mountain range or the vast interior of a continent often introduces elements of latitude, temperature, and precipitation that result in a particular dry, hot dry, or very wet condition such as the monsoons of South Asia.
Strategy 2 |
Making Predictions Based on Available Evidence
Access the Interactive World Climate Map at:
http://www.uwsp.edu/geo/faculty/ritter/interactive_climate_map/climate_map.html
- Have the students use the Global Climate Assessment Chart to record information from three of the sites on the Interactive World Climate Map. Select one near the equator (Iquitos, Mangalore –Banglaore), one mid-latitude (Chicago) and one in the high latitudes (Irkutsk).
- Ask the students to enter the information concerning the latitude, the temperature in July, and the temperature in January. Use the classifications in the top row of the table to generalize about the temperature.
- Have students classify each location as high, middle, or low latitude. Then ask about the July temperature. Will it be hot, warm, cool, or cold?
- Ask about the January temperature. Will it be hot, warm, cool, or cold? Why?
- In the annul precipitation column, write what the precipitation is for the place. Use the classifications wet, dry, or wet/dry season. For example, Phoenix is dry; Mangalore has wet/dry seasons.
- As a final check of the climates at the locations, click on the symbol on the map and a set of information pops up that provides greater detail.
|
Place
|
Latitude
(high, middle, low) |
July Temperature
(hot, warm, cool, cold) |
January Temperature
(hot, warm, cool, cold) |
Annual Precipitation
(wet, dry, wet/dry seasons) |
Strategy 3 |
Research and Presentation Skills
Review the Koppen Climate Classification System with the students.
A – Tropical Moist Climates: all months have average temperatures above 18° Celsius.
B – Dry Climates: with deficient precipitation during most of the year.
C – Moist Mid-latitude Climates: with Mild Winters.
D – Moist Mid-Latitude Climates: with Cold Winters.
E – Polar Climates: with extremely cold winters and summers.
- Divide the class into five groups and assign each group a climatic region. Take the class to the computer lab to do additional research on their climatic region. This website is useful: www.physicalgeography.net.
- Have each group prepare a presentation to the class on why they should plan a visit to their area of world this summer. Have them prepare a travel brochure, which accurately reflects how people live in their area of the world using the following Criteria for Presentation:
- The kind of vegetation they will see
- The wildlife they will see
- The kinds of houses they will see
- The kind of food that might be available
- The kind of recreation they might find
Check for Understanding
Following the presentations, ask the class to write a paragraph addressing the following question:
- How does climate affect the way people live? Use examples from the presentations to support your thinking.