
Nebraska YRBS Results
The Youth Risk Behavior Survey (YRBS)
The Youth Risk Behavior Survey (YRBS) is part of the National Youth Risk Behavior Surveillance System created and managed by the Centers for Disease Control and Prevention (CDC).
This statewide survey is designed to monitor categories of health-related behaviors that contribute to the leading causes of death and disability among youth and adults, including—
- Behaviors that contribute to unintentional injuries and violence
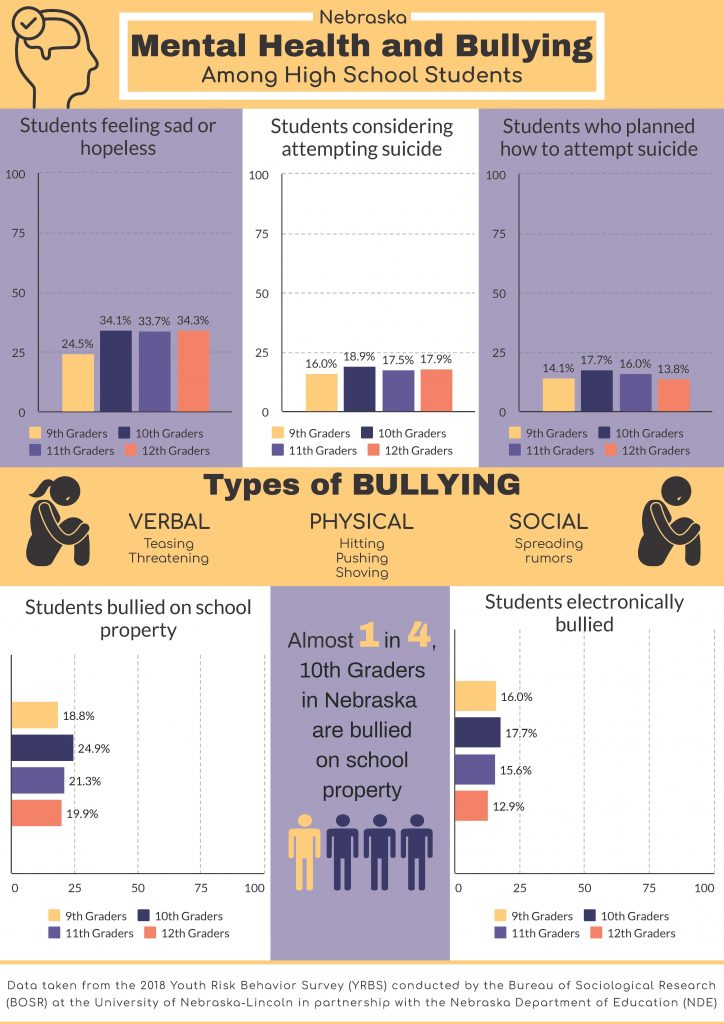
- Mental health challenges experienced by youth
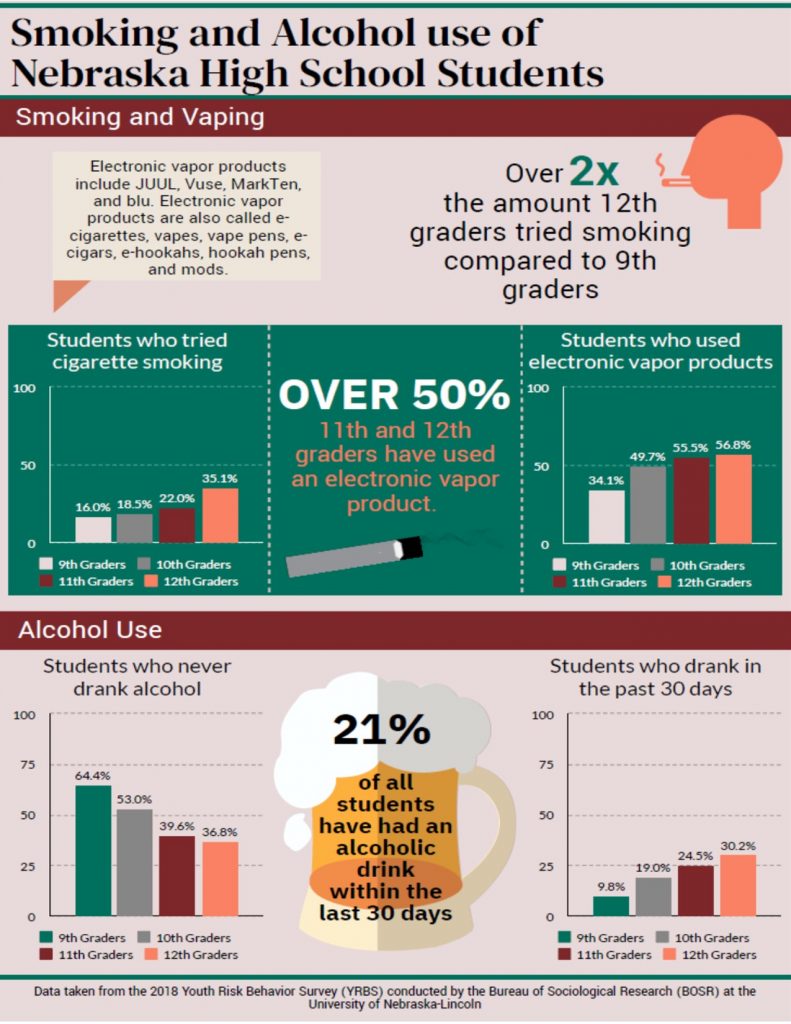
- Alcohol, tobacco, and other drug use
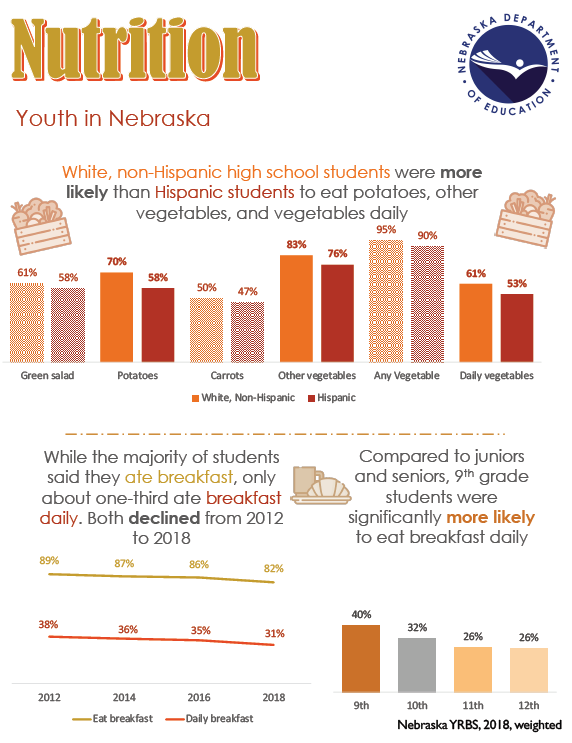
- Current dietary behaviors
- Physical activity levels
The YRBS also measures the prevalence of obesity, asthma, and other behaviors that impact chronic absenteeism rates, academic performance, and post-secondary success.
All Nebraska public schools are eligible to participate. In a random sample of schools, students in 9th-12th grade classes are chosen from a random sample within their school and are asked to complete the YRBS. Nebraska has been administered in Nebraska biannually since 1991.
We appreciate the collaboration from school districts across the state in helping us collect this valuable data. Your contributions are very much appreciated, and we aim to provide data and tools back to our school and community partners.
As a result, we have summarized the state-level data inculding 2023 YRBS findings (youth level data) aligned with 2024 School Health Profile results (educator level data), to highlight the experiences of youth and what schools are doing to address these gaps, and are outlined here:
The Student Health and Risk Prevention (SHARP) Surveillance System
The Nebraska Youth Risk Behavior Survey (YRBS) is part of the Student Health and Risk Prevention (SHARP) Surveillance System. This system is the umbrella uniting the Youth Risk Behavior Survey (YRBS), Youth Tobacco Survey (YTS), and Nebraska Risk and Protective Factor Student Survey (NRPFSS). All three of these surveys are administered in the fall of even calendar years. The Bureau of Sociological Research (BOSR) manages these surveys on behalf of the Nebraska Department of Education (NDE) and the Nebraska Department of Health and Human Services (NDHHS).
For more information, please contact: Jessie Coffey at jessie.coffey@nebraska.gov, 402-617-5796 or visit https://www.cdc.gov/healthyyouth/data/yrbs/index.htm.
2023 YRBS Results
The 2023 Youth Risk Behavior Survey (YRBS) was completed by 586 Nebraska students in 22 public high schools during the fall of 2023. The school response rate was 44%, the student response rate was 57%, and the overall response rate was 25%. The results are representative of all students in grades 9-12. Students, 300 female and 286 male, completed a self-administered, anonymous, 95-item questionnaire. Survey procedures were designed to protect the privacy of students by allowing for anonymous and voluntary participation.

2023 YRBS Data Set
Graphs/Charts – Please view the slides below if you are interested in seeing graphs/charts from each survey question.
Physical Risk Behaviors & School Safety
Physical Activity & Screen Time
View the Trend Data Report
2023 YRBS Infographics
Click on the image to download a PDF.

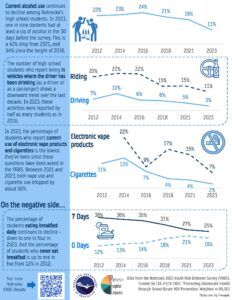
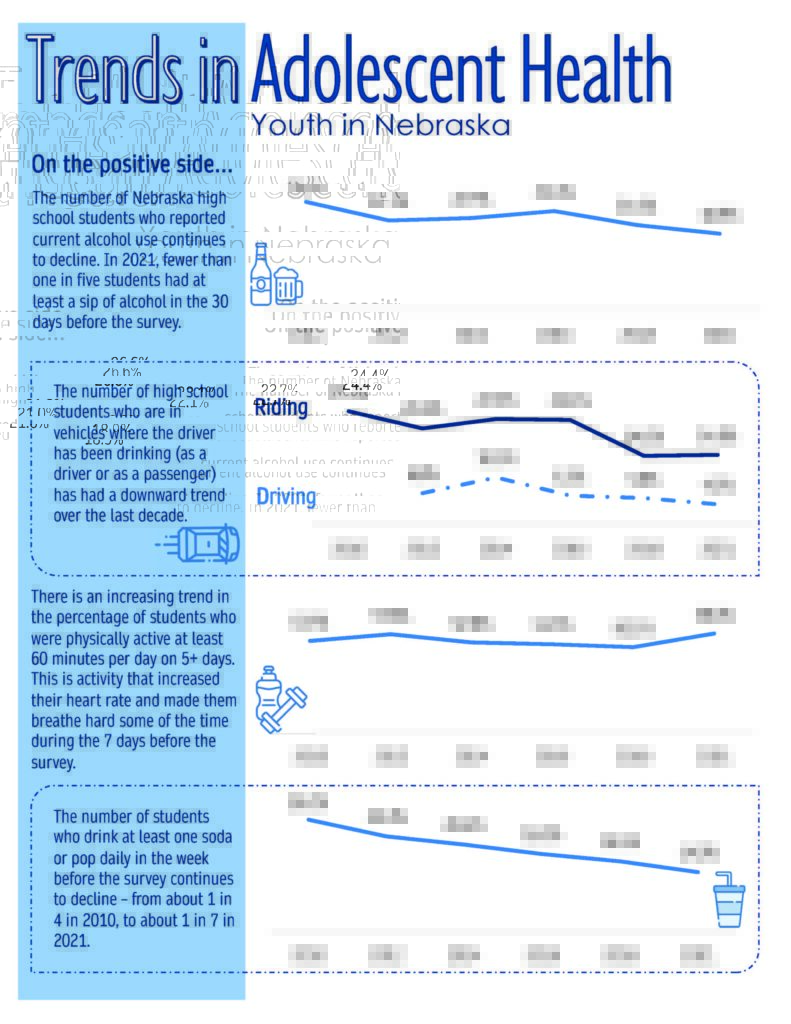
2023 Adolescent Health trend data.

2023 Substance use data fact sheet
2023 health data fact sheet

2023 alcohol use trend data fact sheet

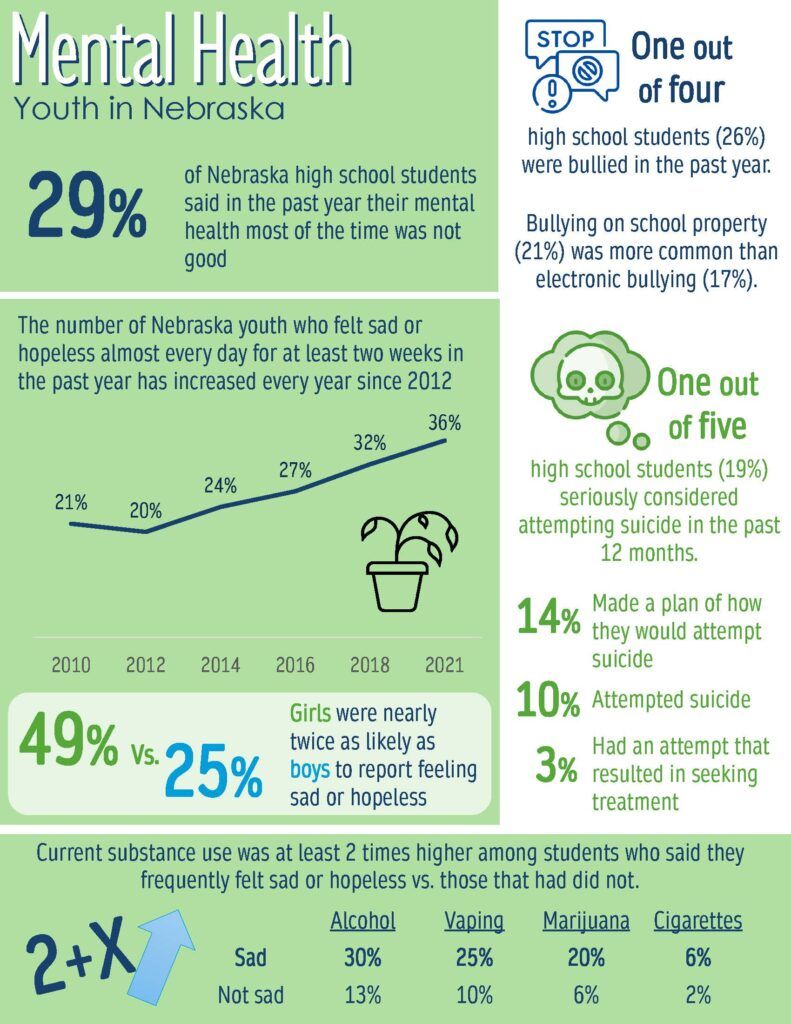
2023 mental health overiew fact sheet

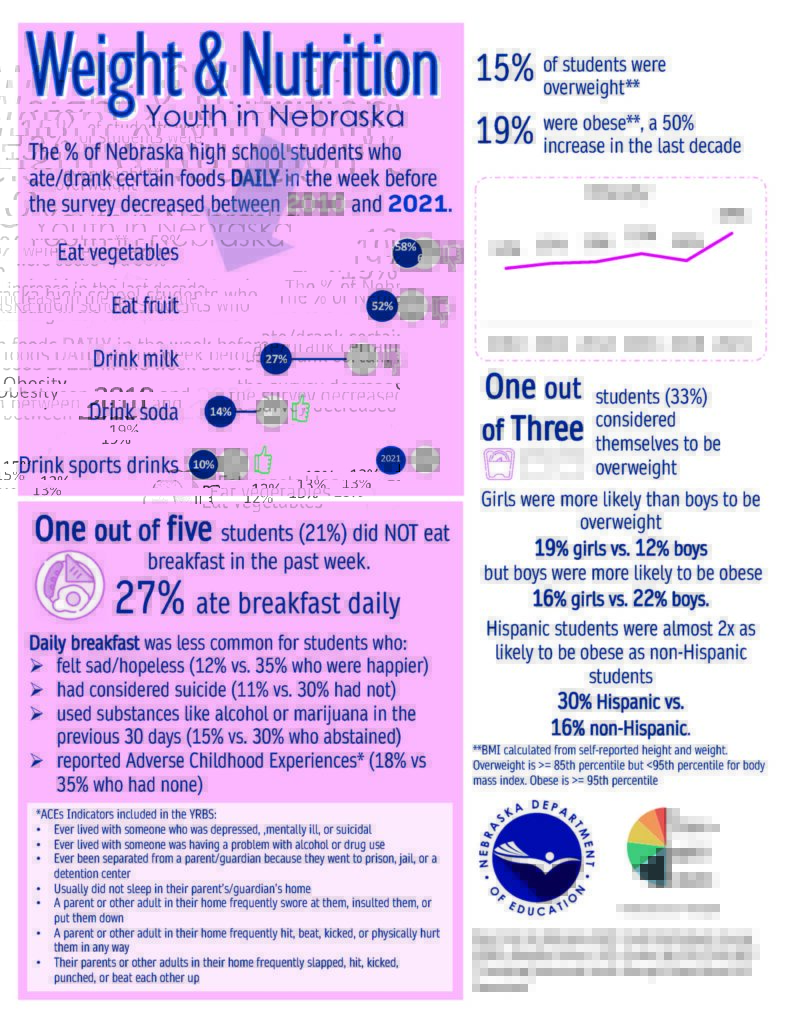
2023 weight and nutrition overiew fact sheet

2023 physical activity overiew fact sheet
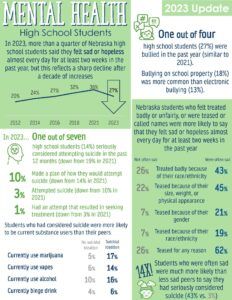
2023 high school students and mental health fact sheet
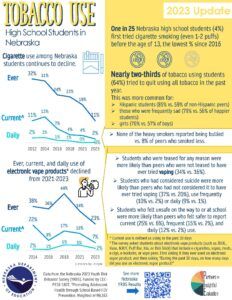
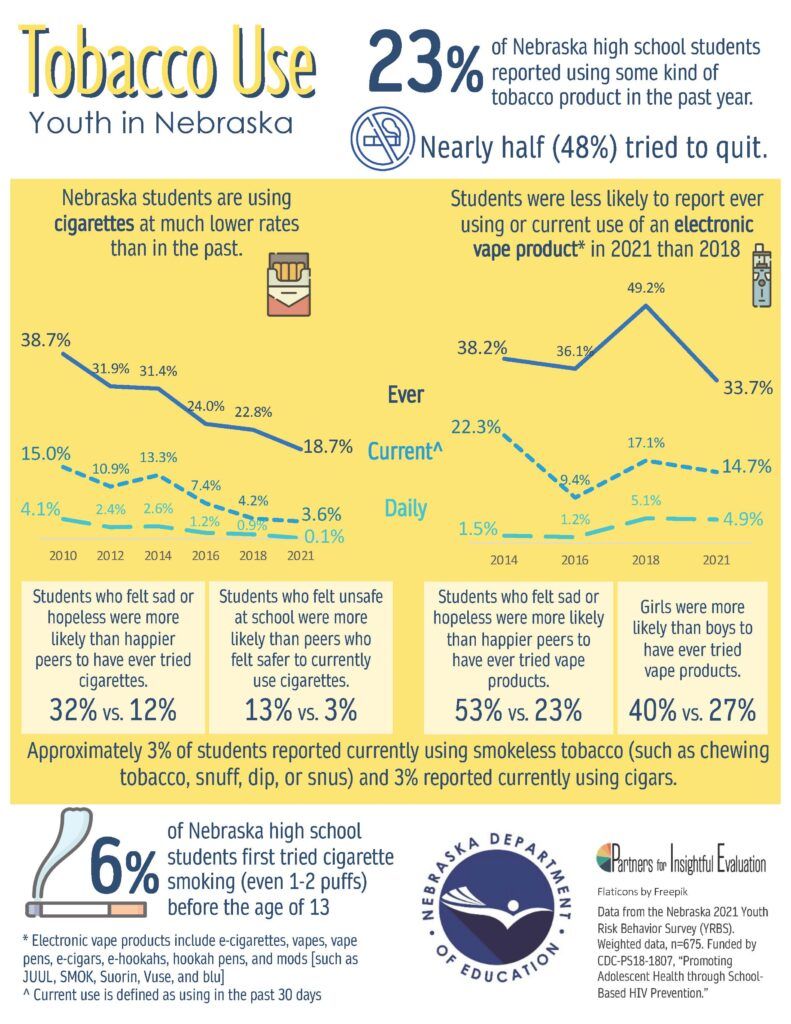
2023 tobacco use fact sheet
2023 Nebraska adolescent Health Report
Together, NDE and NDHHS monitor how common and widespread various health risk behaviors are among Nebraska youth. Vital statistics records and surveys provide data for this monitoring and the measurement of change and progress towards health goals. This report focuses on the results of two sets of data collection in Nebraska: The Youth Risk Behavior Survey (YRBS) and the School Health Profiles (SHP).
Full Report Report Infographics
Nebraska has been administering the YRBS since 1991. Past administration data can be found below.
2021 YRBS Survey Results
The Nebraska 2021 survey was completed by 676 students across the state. Each high school grade level was represented; with 24.7% of survey completed by 9th graders, 24.8% of surveys completed by 10th graders, 24.5% of surveys completed by 11th graders and 25.6% of surveys completed by 12th graders. Ethnicities represented include: Black 6.7%, Hispanic/Latino 19.3%, White 66.1%, Multiple Races 4.6%, Other 3.2%

Demographic Table, Weighted Data
Graphs/Charts – Please view the slides below if you are interested in seeing graphs/charts from each survey question.
Mental Health Nutrition & Obesity Physical Activity & Screen Time
Physical Risk Behaviors & School Safety Substance Use
View the Trend Data Report.
2021 YRBS Infographics


2018 Nebraska YRBS Data Highlights
Click on infographic to view
2018-2019 YRBS Infographics


2018-19 Nebraska YRBS Results
2018NEH_Demographic_Table (pdf)
2018NEH_Detail_Tables (pdf)
2018NEH_Graphs (powerpoint)
2018NEH_Sample_Description (pdf)
2018NEH_Sample_Statistics (pdf)
2018NEH Summary Tables (pdf)
2018NEH_Trend_Report_10_Years (pdf)
2018NEH_Trend_Report (pdf)
Nebraska Adolescent Report 2018-2019